A newspaper page for my family's money
Two private dashboards I use to track my ETF portfolio and simulate my kid's college fund for the next 17 years. An LLM is the input form and git is the database.
Built with JavaScript and Canvas 2D, Finnhub API, Exchange rate APIs, AWS S3, Claude Code, Cloudflare Pages and Cloudflare Access
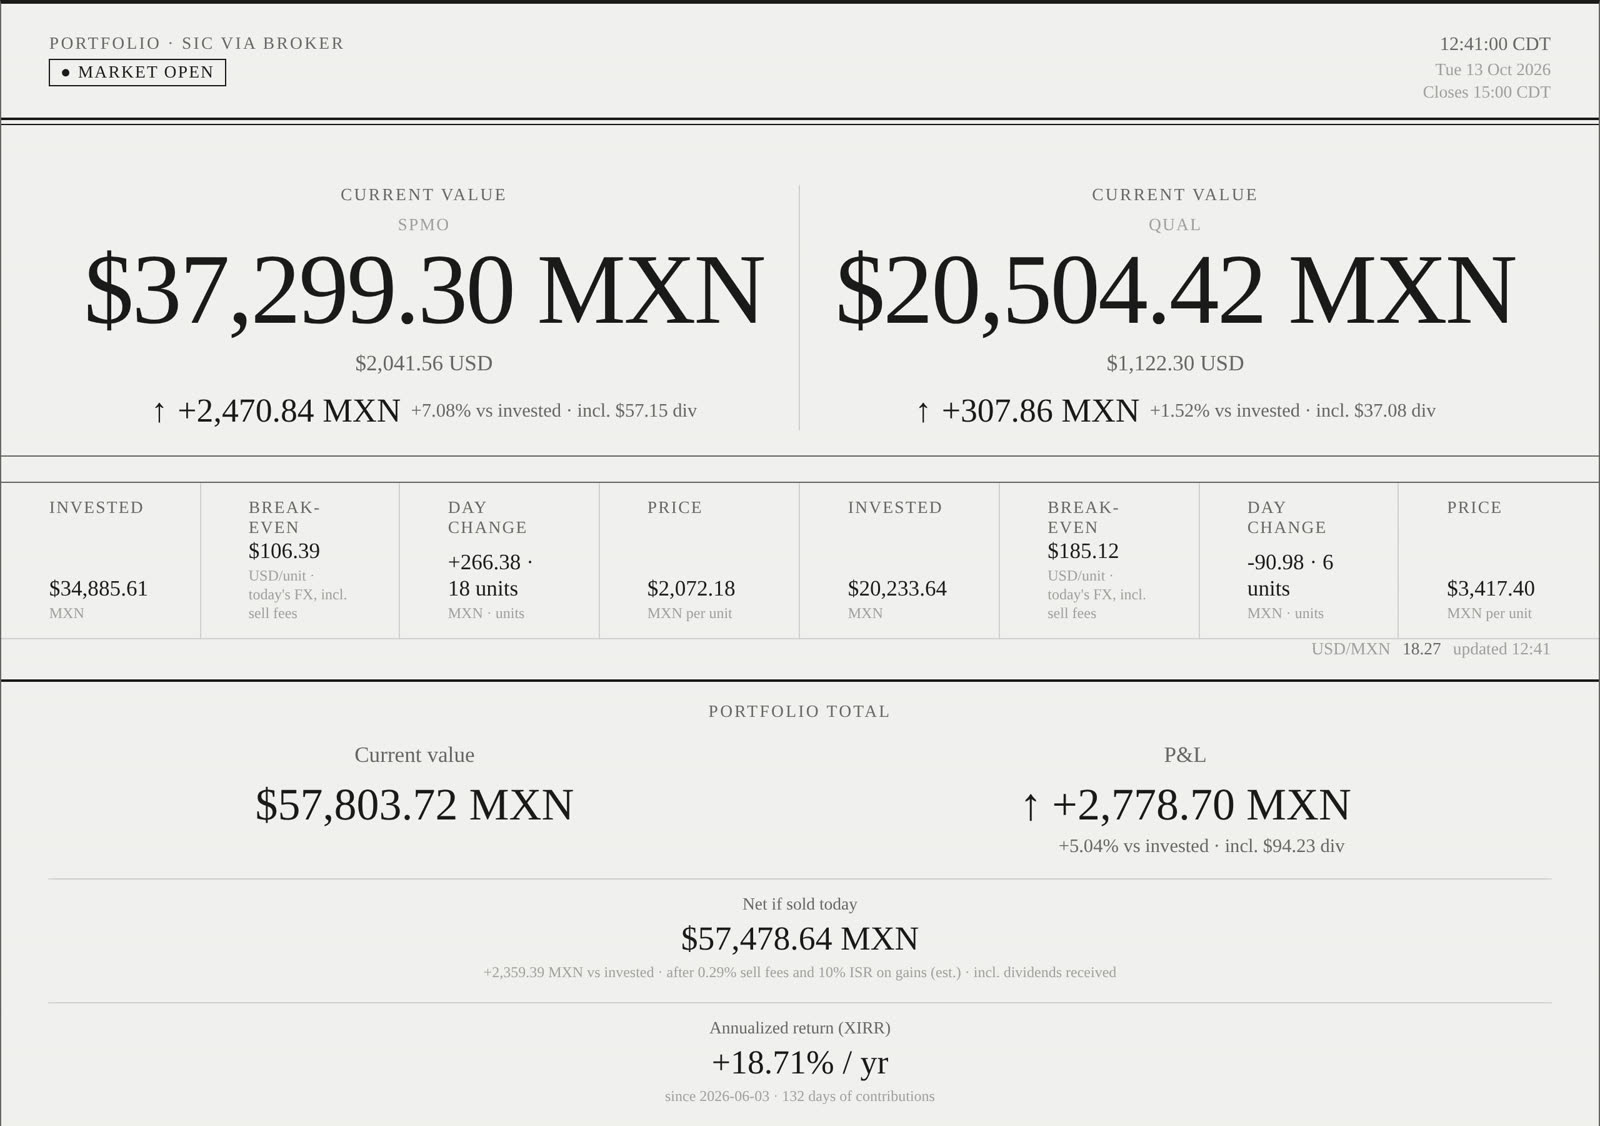
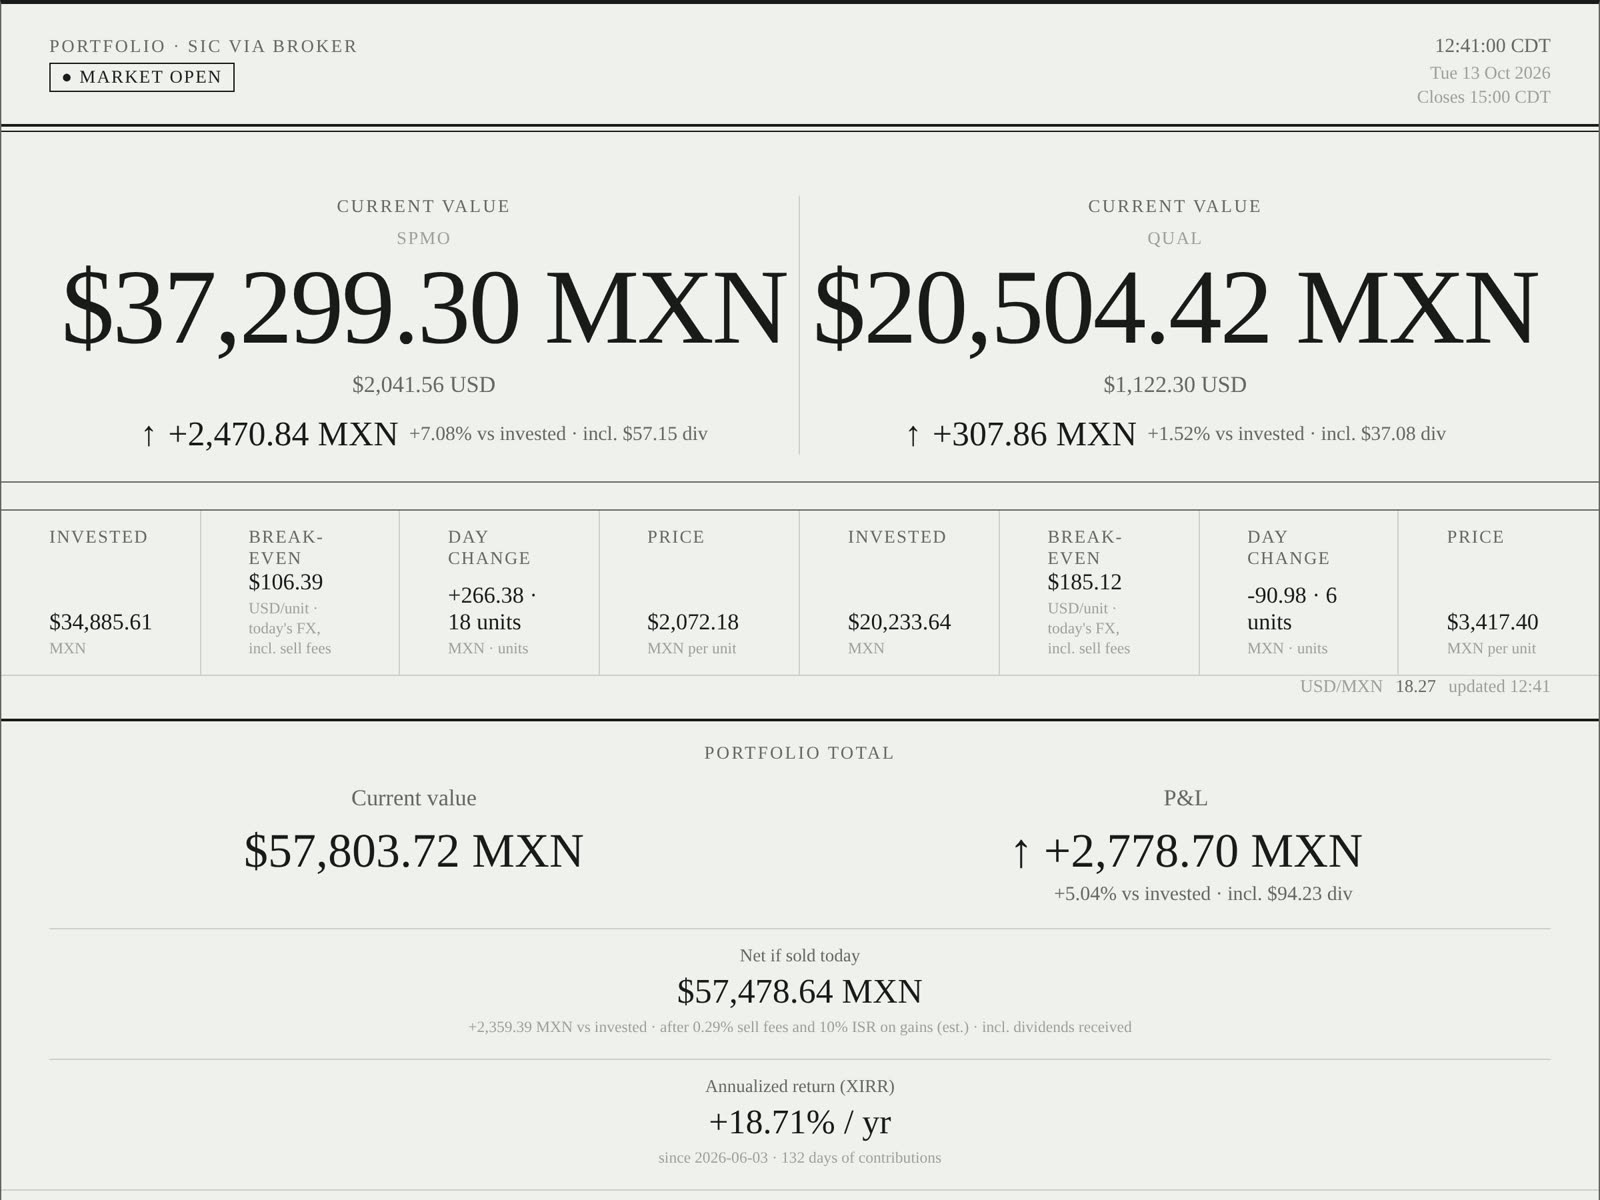
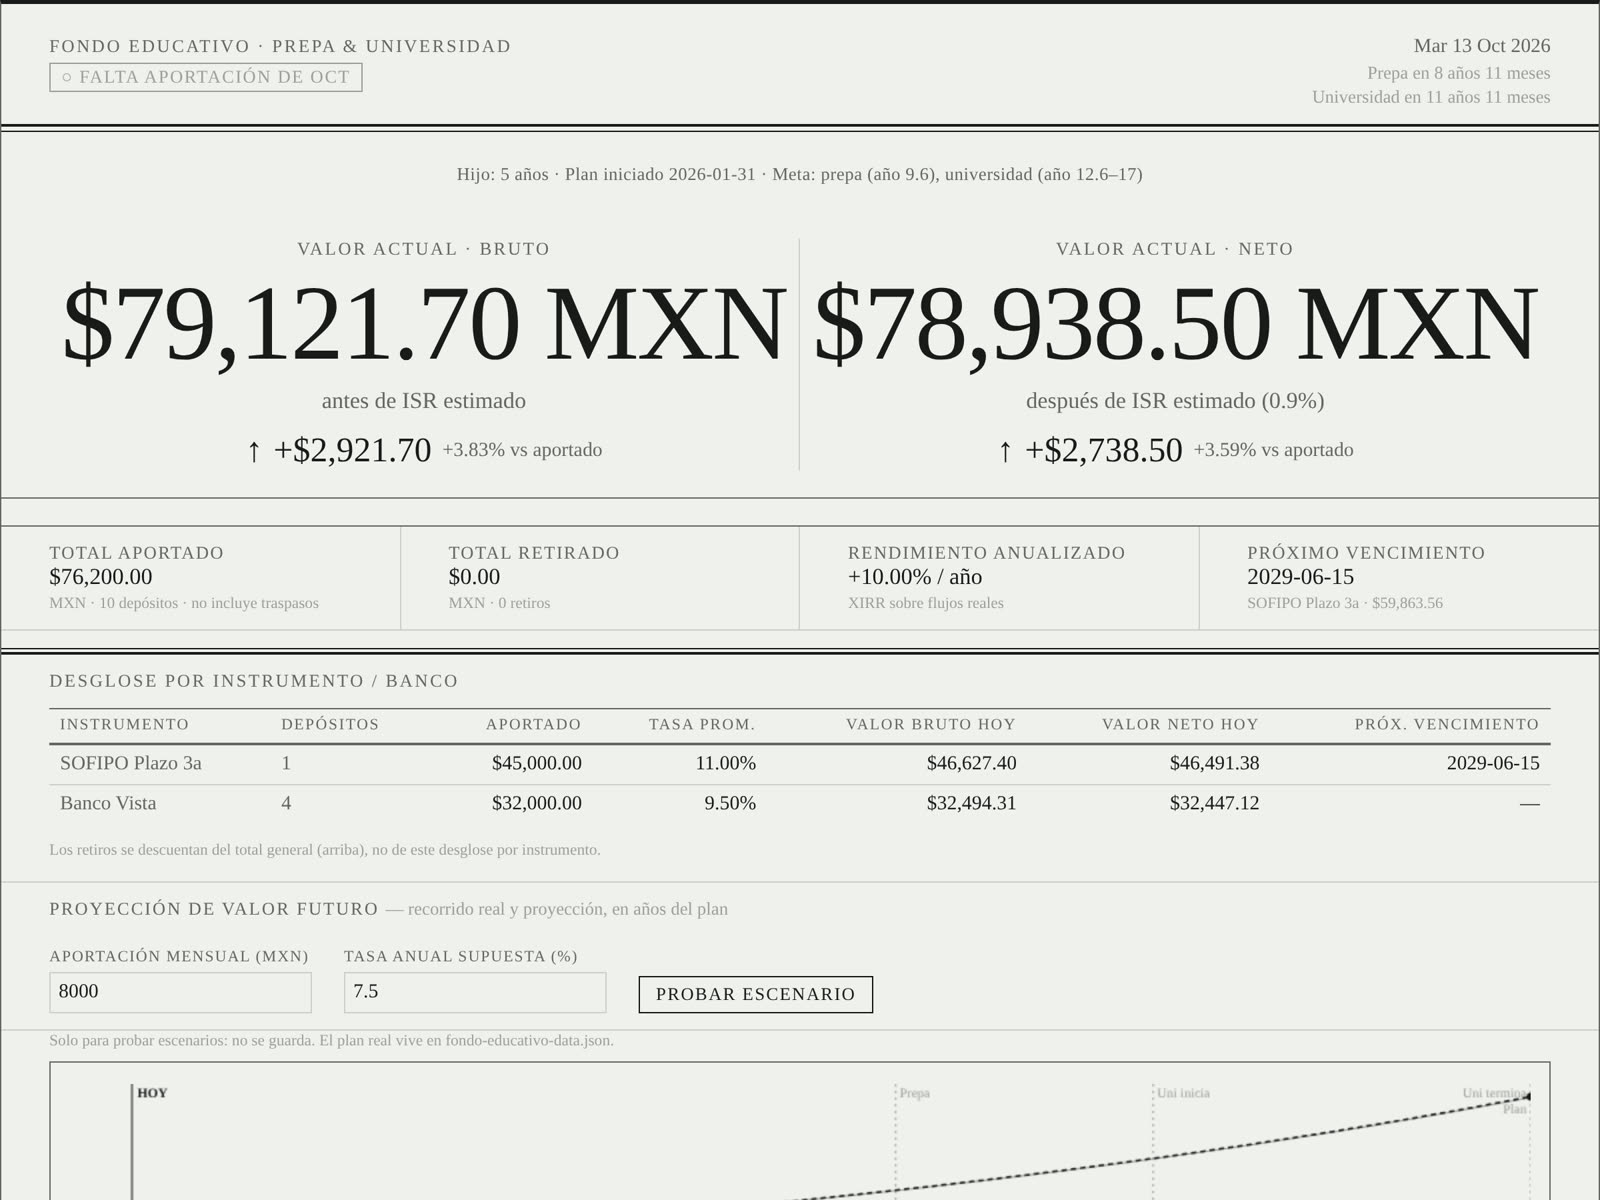
I wanted to know, on any given afternoon, whether my money was doing better than just leaving it in the bank. Then I wanted to know whether my kid’s college fund would actually make it to the last semester of university. So I built two dashboards, styled like the markets page of a printed newspaper and meant to sit on an e-ink screen.
Both are private. Every number in these screenshots comes from demo data.
At a glance
- My role: product, financial logic, design and deployment.
- Timeline: first commit on June 10, 2026, and still in use. 18 commits so far.
- Scope: two pages. One is a live ETF portfolio tracker. The other is a college-savings planner with a 17-year, month-by-month simulator.
- How: static pages, no backend. An LLM is the only way data gets in, and git is the database.
An LLM instead of a form
The college-fund page has no inputs at all. When I make a deposit, I tell Claude Code “agrega mi aportación de octubre” and it updates the data file for me.
What makes that safe is a written contract in the repo. It says:
- which fields every deposit has, and which defaults to use when I leave something out (the rate and bank of my last deposit at that same bank)
- when to ask instead of guess, like a term deposit with no maturity date or a withdrawal with no concept
- to check that the file is still valid, then read the change back to me in one line
- to ask before publishing anything
Every change is a commit I approve, so the history of the fund is the git log. The model never touches the page itself when it adds data.
I used the same idea for the design. Once the look was settled, I wrote it down as a style guide made for agents: six colors, one typeface, and a list of “must” and “must not” rules with a self-check at the end. Any tool I hand it to can reproduce the same page.
And I used it as a thinking partner. The college plan started as a written strategy. Then I turned that strategy into a simulator inside the dashboard so I could test it, and the simulator proved part of it wrong (more on that below).
Where the numbers come from
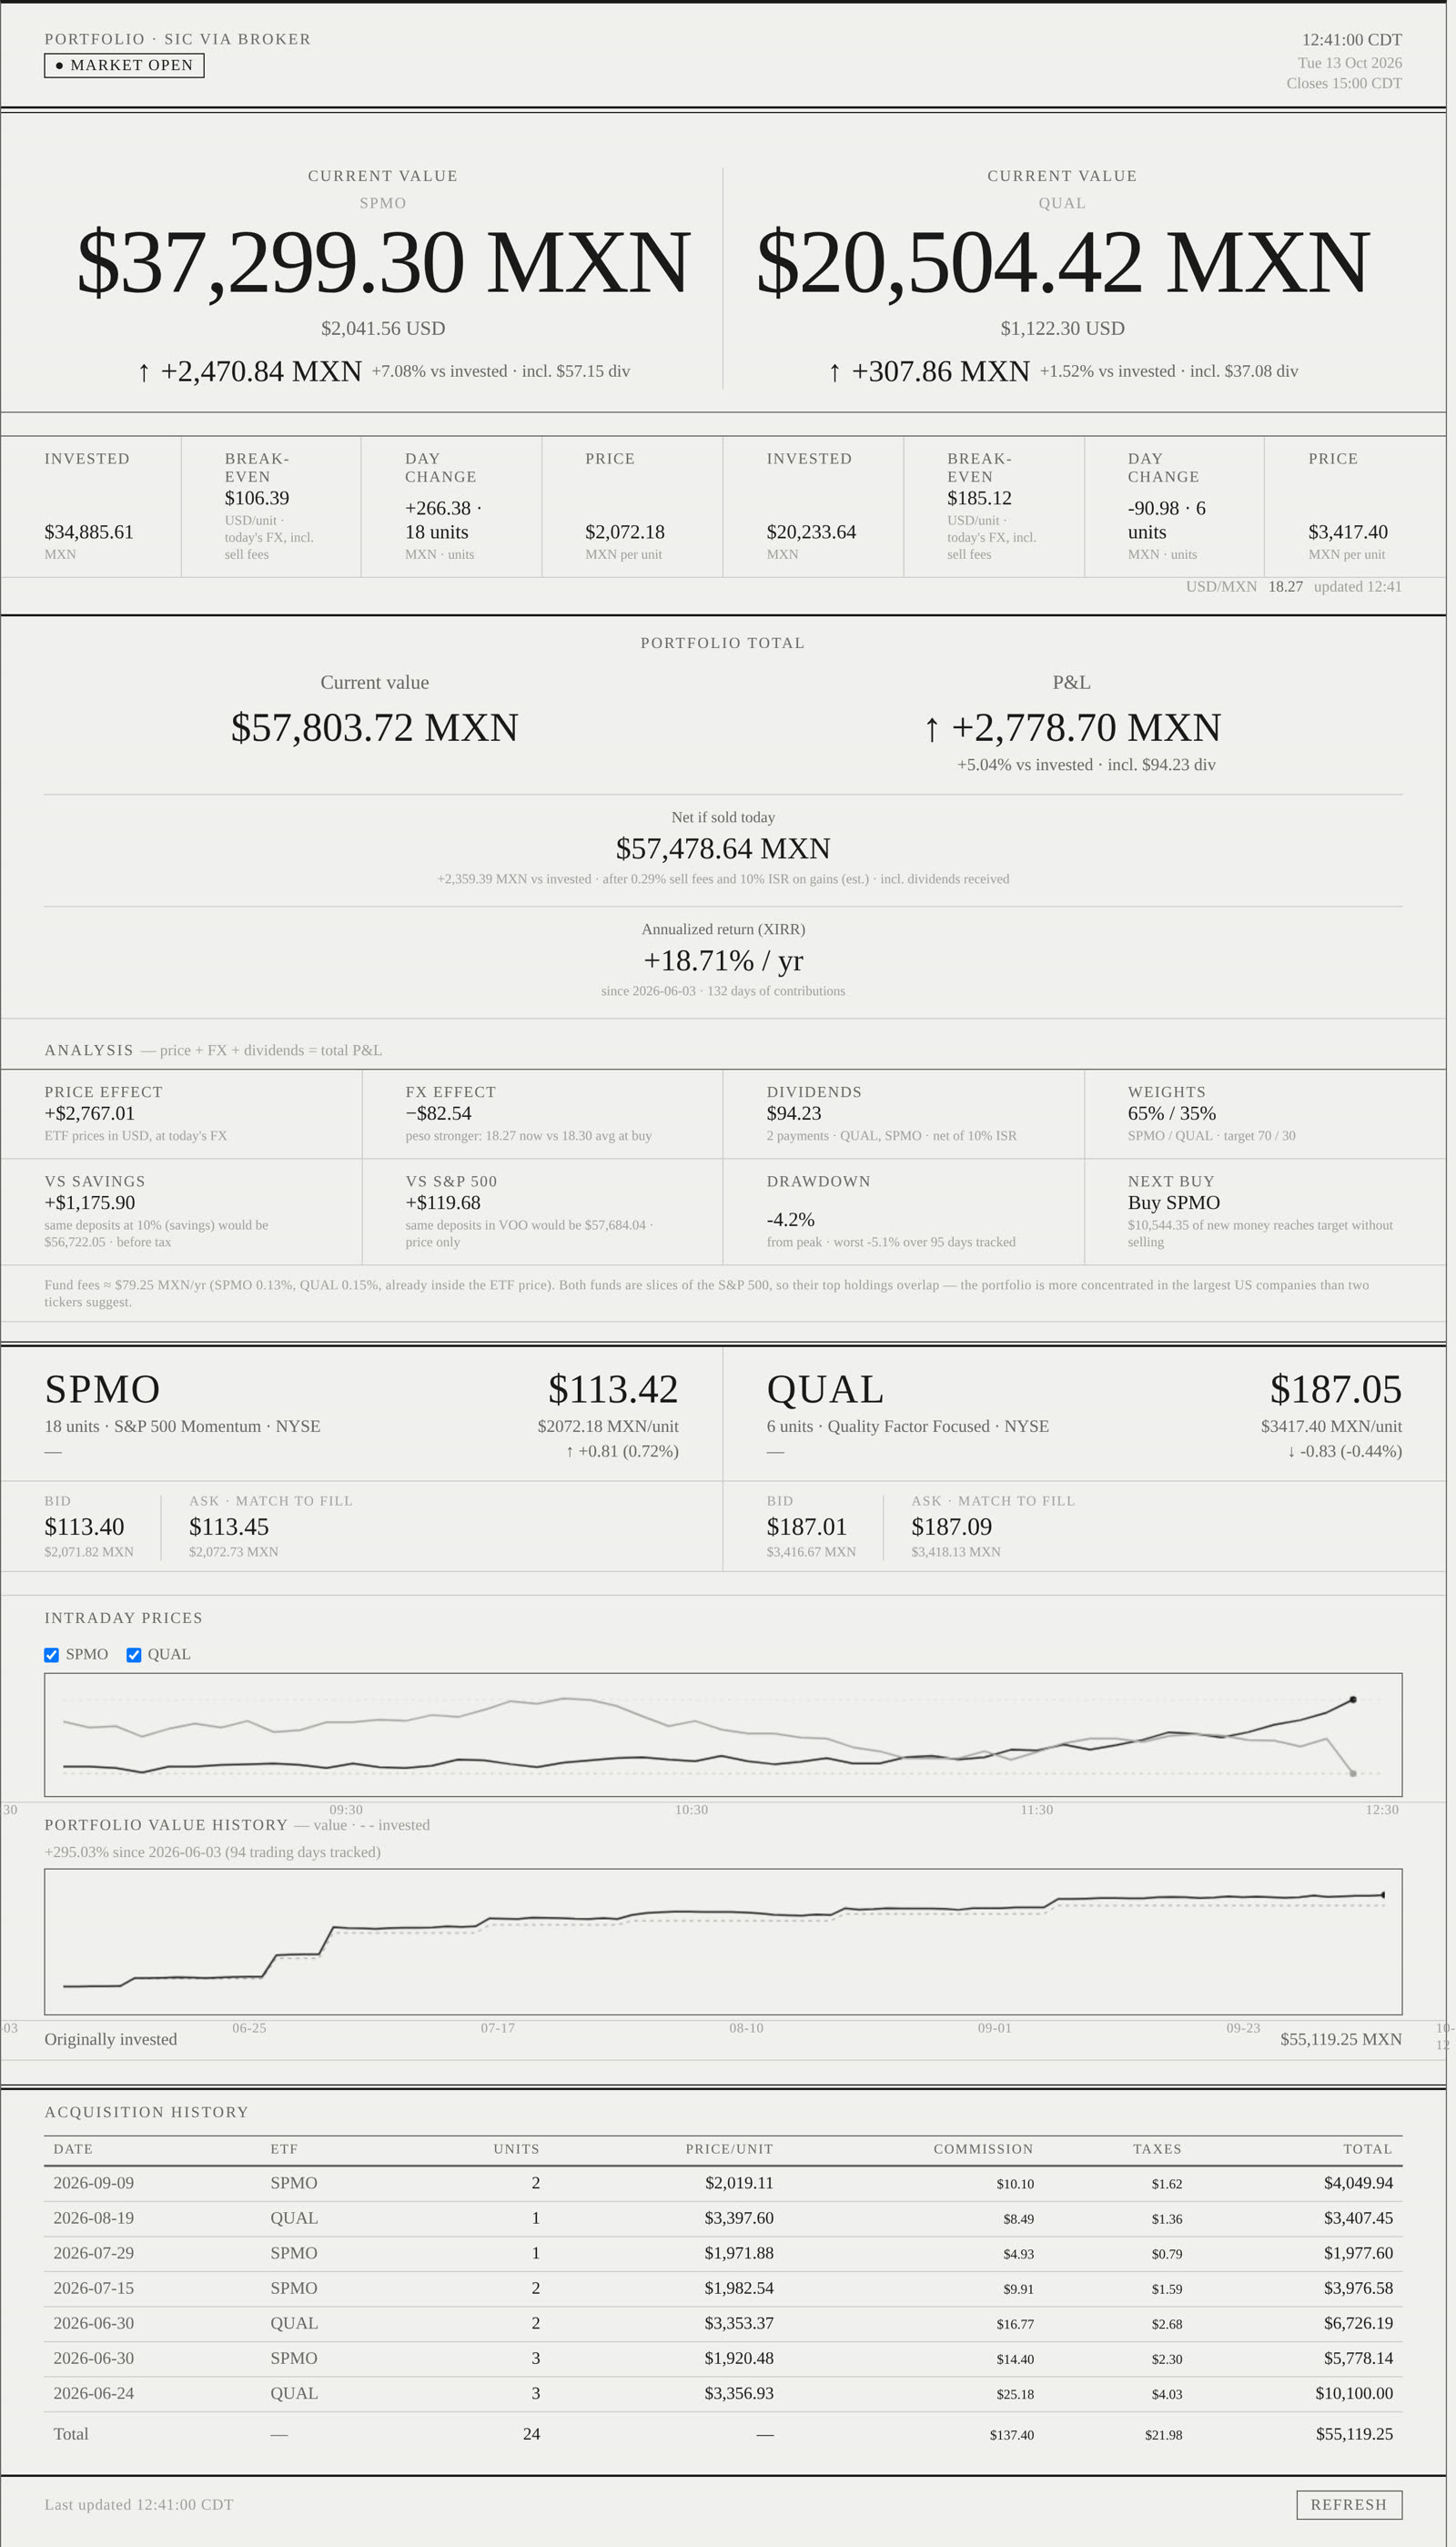
- Live quotes, bid and ask: Finnhub. Bid and ask matter because they’re the price I’d actually get if I sold right now.
- The benchmark: VOO, a plain S&P 500 fund, from the same API.
- Dollars to pesos: a live exchange-rate API, plus the official ECB rate saved with each purchase on the day I made it.
- Daily history: a snapshot saved after the market closes, as a JSON file in S3.
- The college fund: one JSON file in the git repo.
The tracker only asks for prices when they can change. On weekdays it checks every 30 seconds between 08:20 and 15:10 Chicago time, which covers pre-market and the closing price, and it sits idle the rest of the time. That keeps it inside the free tier.
It’s also honest about stale data. If the exchange-rate API fails, it uses the last rate it got and labels it “cached” with its age. You always know how old a number is.
The rules behind the numbers
I buy US ETFs from Mexico, so a plain “you’re up 5%” hides most of what matters. The tracker applies these rules:
- Fees and taxes count. Each purchase includes the broker’s commission and IVA. “Net if sold today” also takes out the selling fee and the 10% ISR on gains. Dividends are recorded after their tax.
- Where the gain comes from. The gain is split into what the ETFs did in dollars, what the peso did since each purchase, and dividends. The three add up to the total exactly. A weaker peso can look like good investing, and this split shows when it isn’t.
- Annualized return (XIRR). It accounts for when each deposit happened. Under 90 days of history, it says the number isn’t meaningful yet.
- Two honest comparisons. The same deposits, on the same dates, into a savings account at 10% and into the S&P 500. If the portfolio can’t beat the bank, I want to know.
- A drawdown deposits can’t fool. It’s measured on value divided by money put in, so a new deposit doesn’t look like a gain or hide a loss.
- What to buy next. The target is 70/30 between the two funds. The page tells me which one to buy and how much new money gets back to the target without selling, because selling costs fees and taxes.
A 17-year plan, simulated month by month
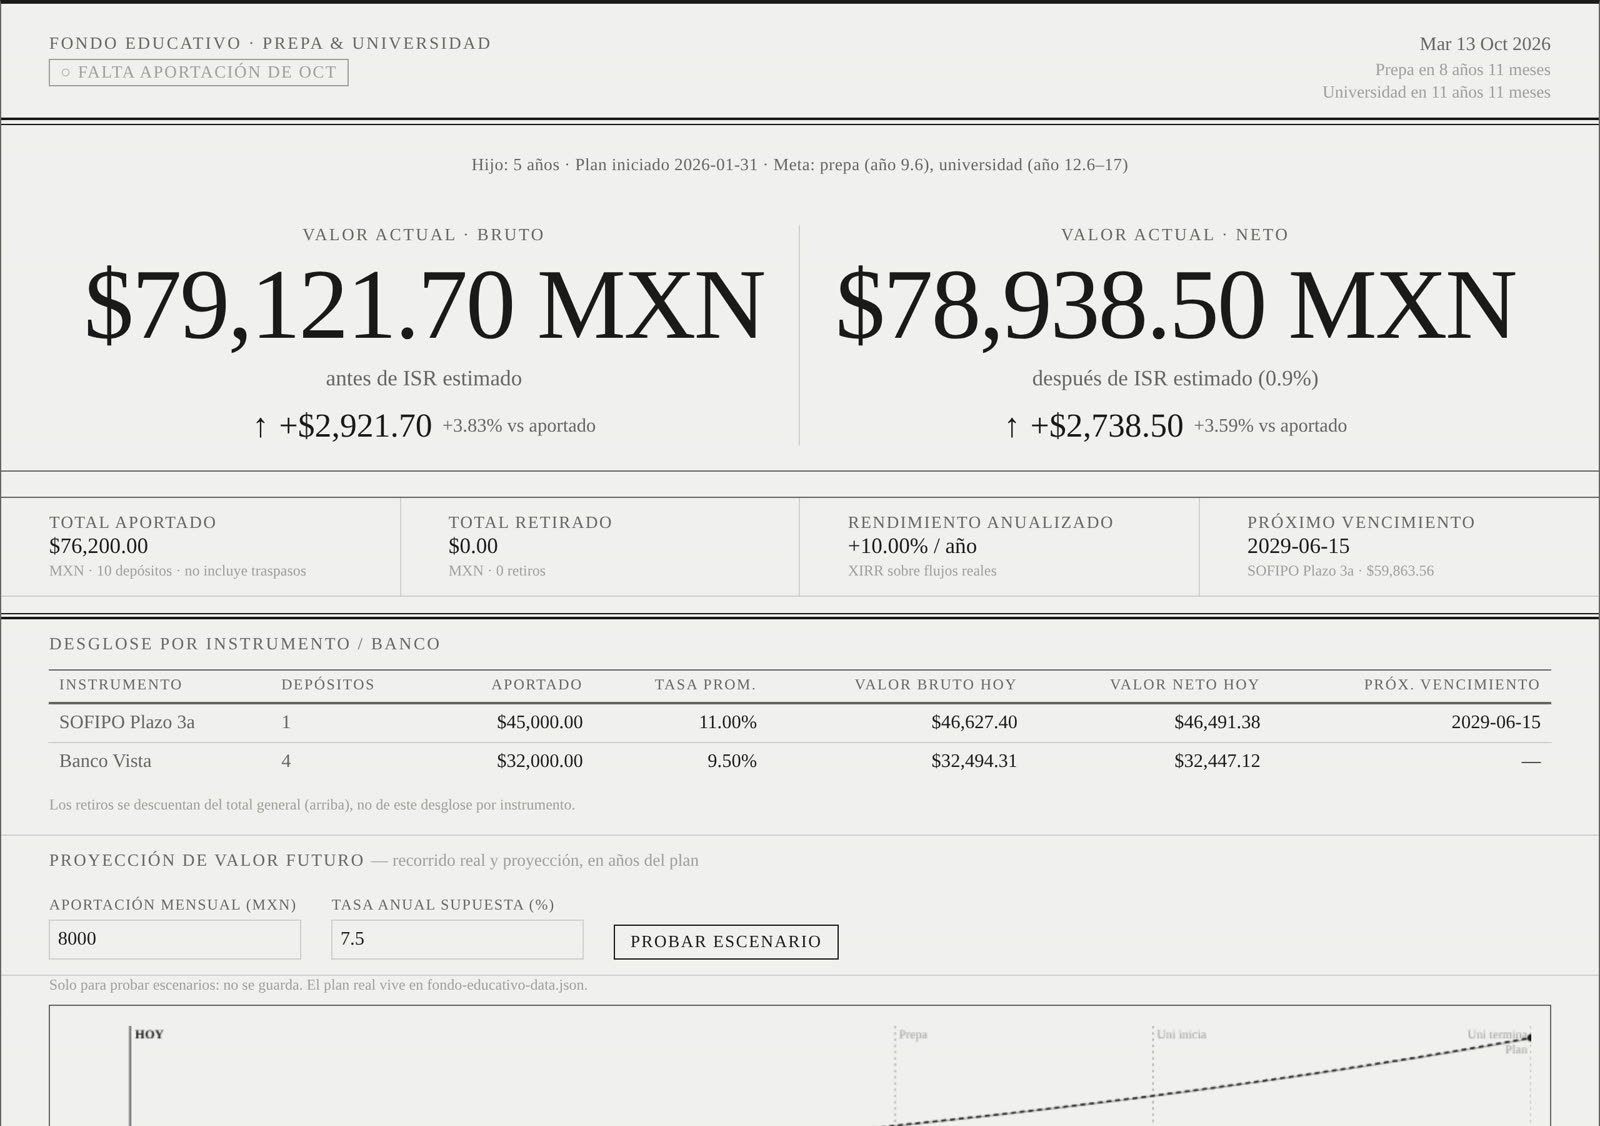
Every deposit in the college fund is its own instrument. Each one has its own rate, compounding (daily, monthly, yearly, or simple for term deposits), maturity date and estimated tax. When money moves from one bank to another, it’s tracked as a transfer, so it isn’t counted twice. The chart shows what really happened, the projection from today, and the original plan, with a sentence saying how far ahead or behind I am.
The plan itself is a ladder of 36 CDs:
- Every month, a new 3-year CD is opened.
- From month 37 on, one matures every month. It gets that month’s contribution added, pays whatever tuition is due, and the rest goes back into a new CD.
- Tuition is split into five payments per semester, and the first one also carries enrollment and insurance.
- Each payment comes from the CD maturing that month first, then a small liquid “buffer” account, then the other options if the scenario uses them: inflation-linked bonds (Udibonos) or dollars.
The written strategy said the buffer would be enough. The simulator said it wasn’t. 36 is a multiple of 6, so enrollment always lands on the same six rungs of the ladder, and those rungs empty out. The money existed, but it was locked in CDs that weren’t maturing that month. So the page now searches for the smallest monthly buffer that leaves no payment uncovered.
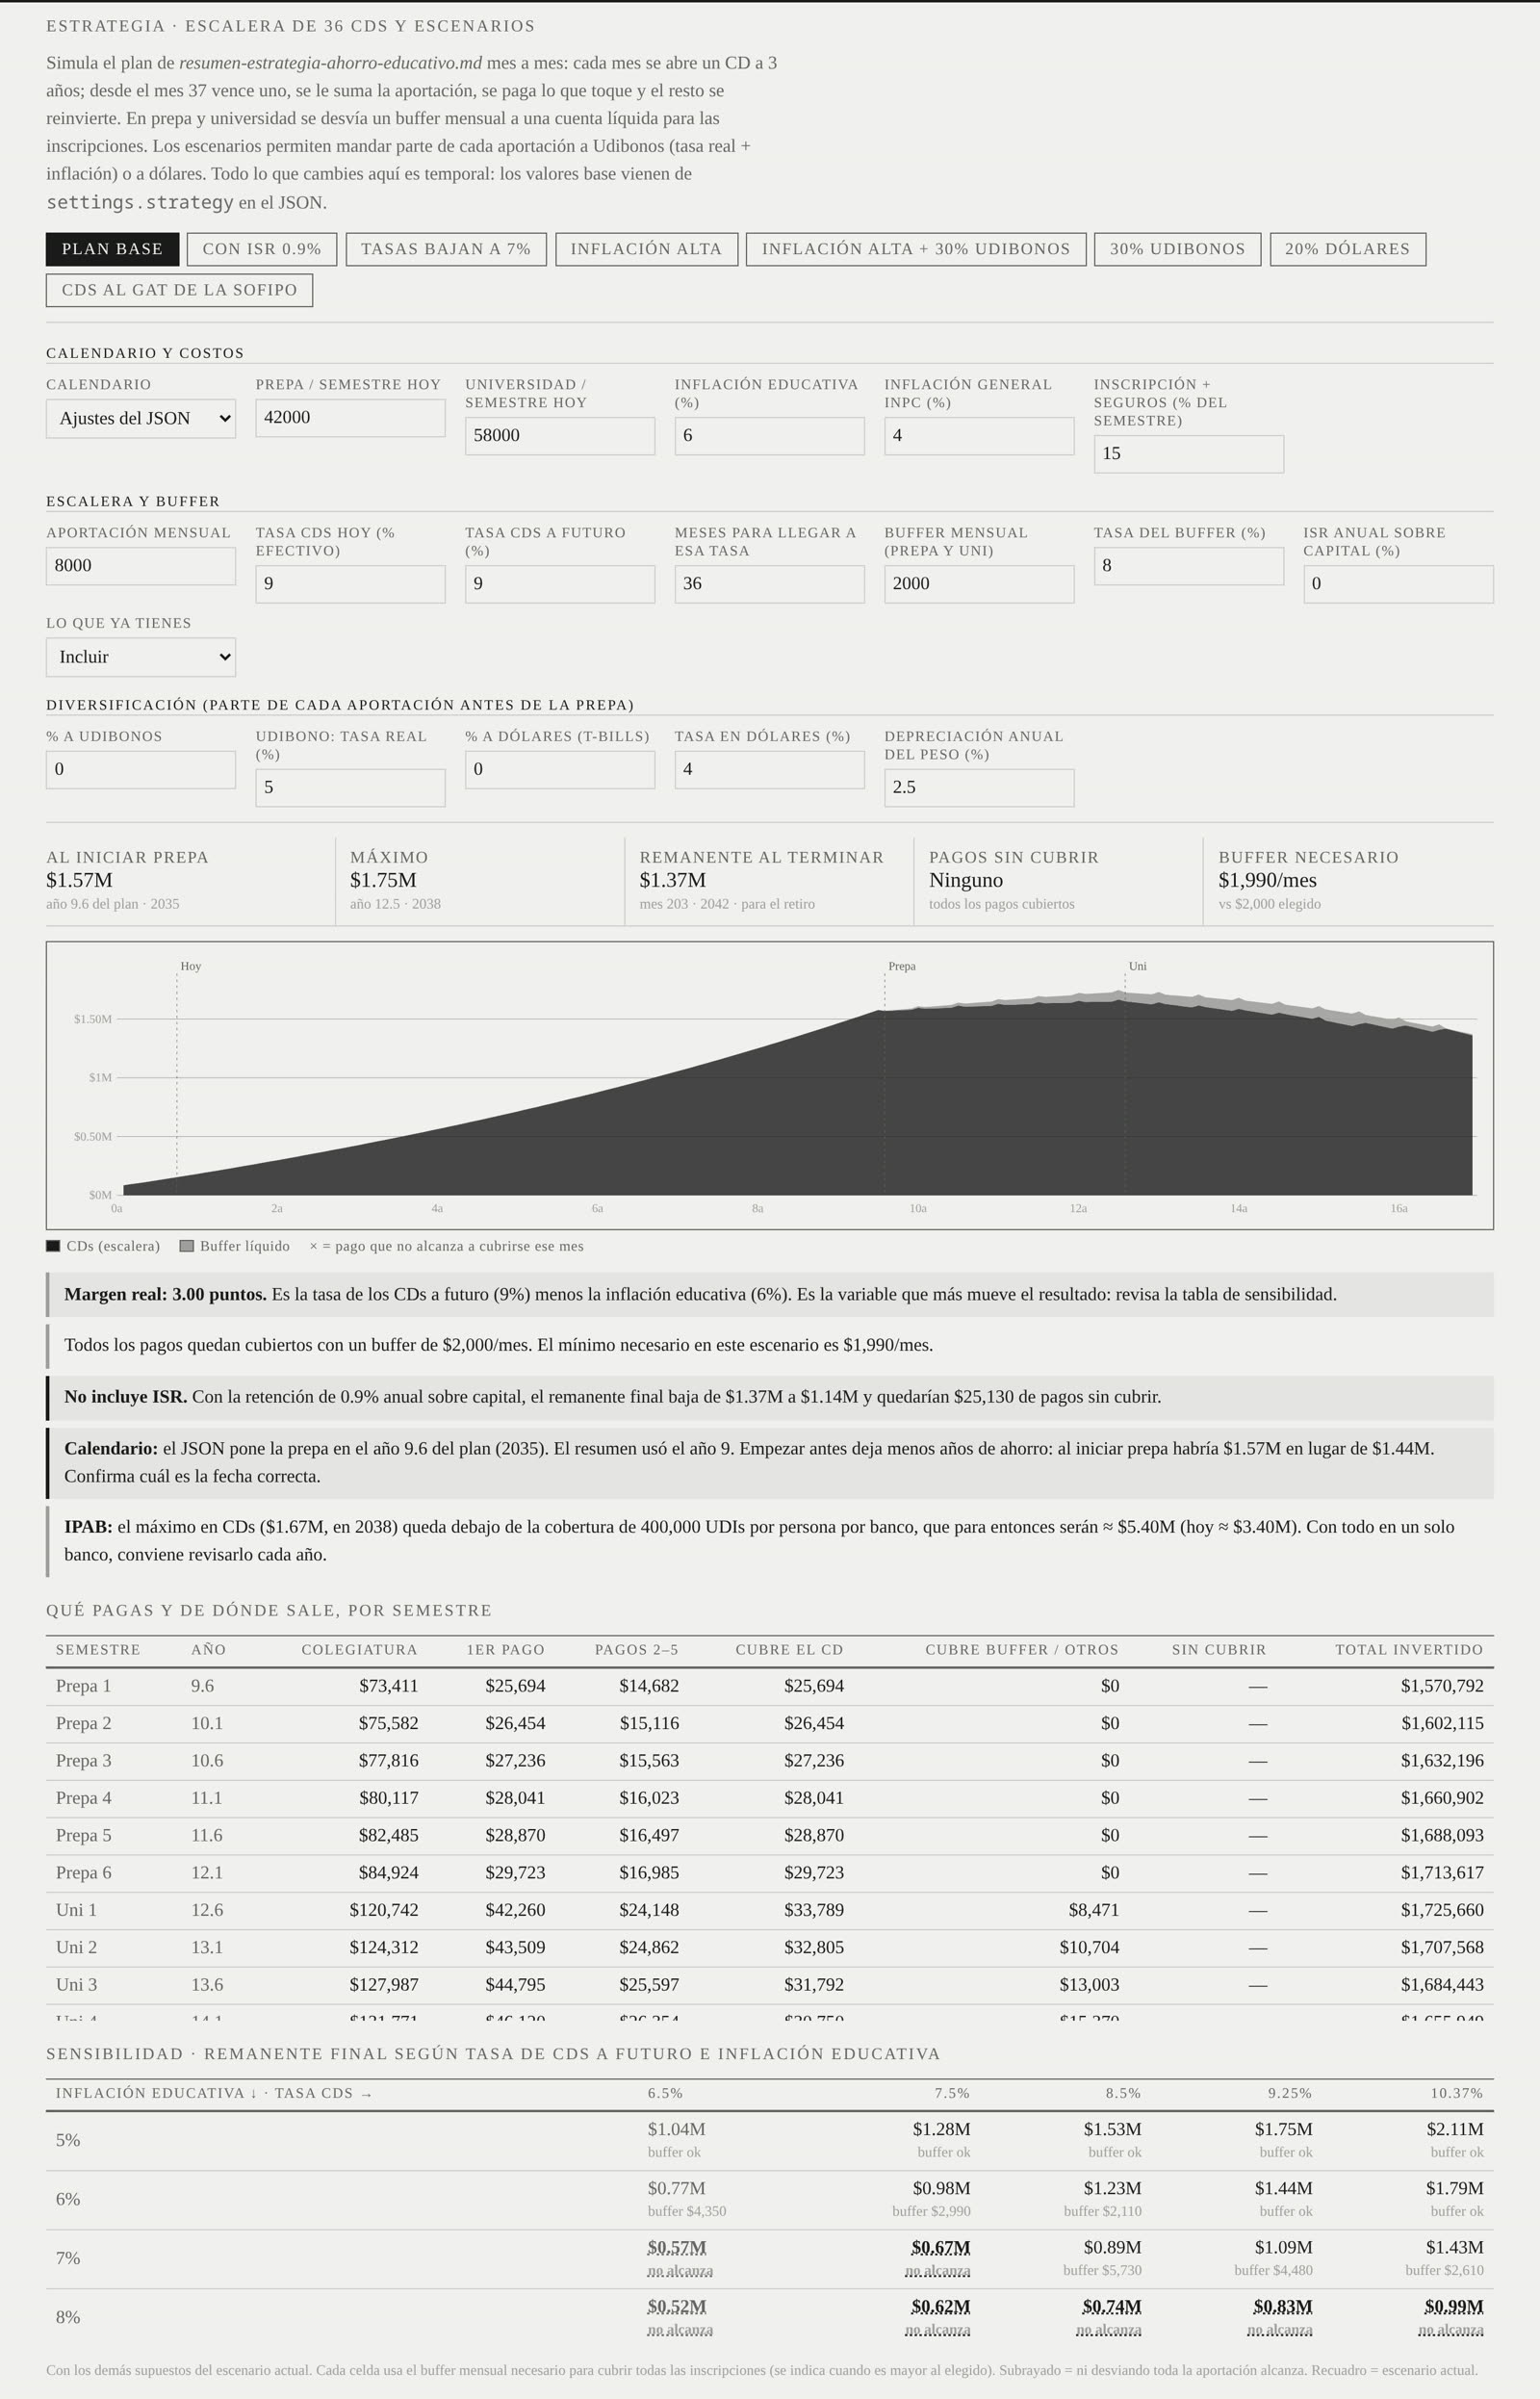
Around it:
- One-click scenarios: with tax withholding, rates falling to 7%, high inflation, 30% in Udibonos, 20% in dollars, a better CD rate.
- A sensitivity grid: the final result for 5 CD rates and 4 education-inflation rates, marking the combinations where the plan doesn’t work at all.
- Warnings in plain language: the real margin (CD rate minus education inflation, the number that moves the result most), the first month money would run short, what tax does to the result, and whether the peak at one bank stays under the IPAB deposit-insurance limit.
A 20-year app that costs $0 a month
This plan runs for 15 to 20 years. A server, a managed database or a paid tier would mean two decades of bills and maintenance for something I check once a day. So it’s a static site on Cloudflare Pages and costs nothing. The data is a JSON file in git, and git already gives me versioning, backups and an audit trail.
Free doesn’t mean open. The repo is private, and the site sits behind Cloudflare Access with multi-factor authentication.
Adding a deposit goes like this: I ask Claude Code, it edits and validates the file, I approve the commit, and Cloudflare redeploys the page.
One ink, no red or green
I designed it to live on a dedicated e-ink screen, like an e-reader, sitting on a desk where I can glance at it the way you’d glance at a newspaper. E-ink has no color, a handful of grays and slow refreshes, so those limits became the design rules.
The look comes from a newspaper markets page: gray newsprint, Georgia, and structure made only from thin and double rules. There’s no color at all. Gains and losses are shown with ↑ ↓ and + −, and chart lines differ by weight, dashes and hatching, never by hue. Big numbers and small uppercase labels stay sharp on a low-resolution screen, and nothing animates. As a bonus, it reads the same for colorblind readers.
What’s next
The tracker polls every 30 seconds. The next step is a live WebSocket feed. The bigger next step is taking what I learned about Mexican fixed income and making it public: a comparator of bank, SOFIPO and CETES rates with a simulator, which is the project I’m building now.
A personal tool with demo data in every screenshot. Not financial advice.